Viewers
Over the years, several online and offline data viewers have been developed for LSL. The list below is by no means complete. If you have created a visualizer for LSL and wish to add it to the list below, please clone this repository, edit this file and submit a pull request. Or, if there is a viewer neglected in the list below, simply post an issue with a link.
Online Viewers
A part of any LSL workbench should be a reliable way to monitor your data. Thus, sturdy, online data visualizers are essential tools. There are a number of stand-alone applications for viewing LSL data in real-time and software packages include online visualization windows.
Stand-alone online viewers:


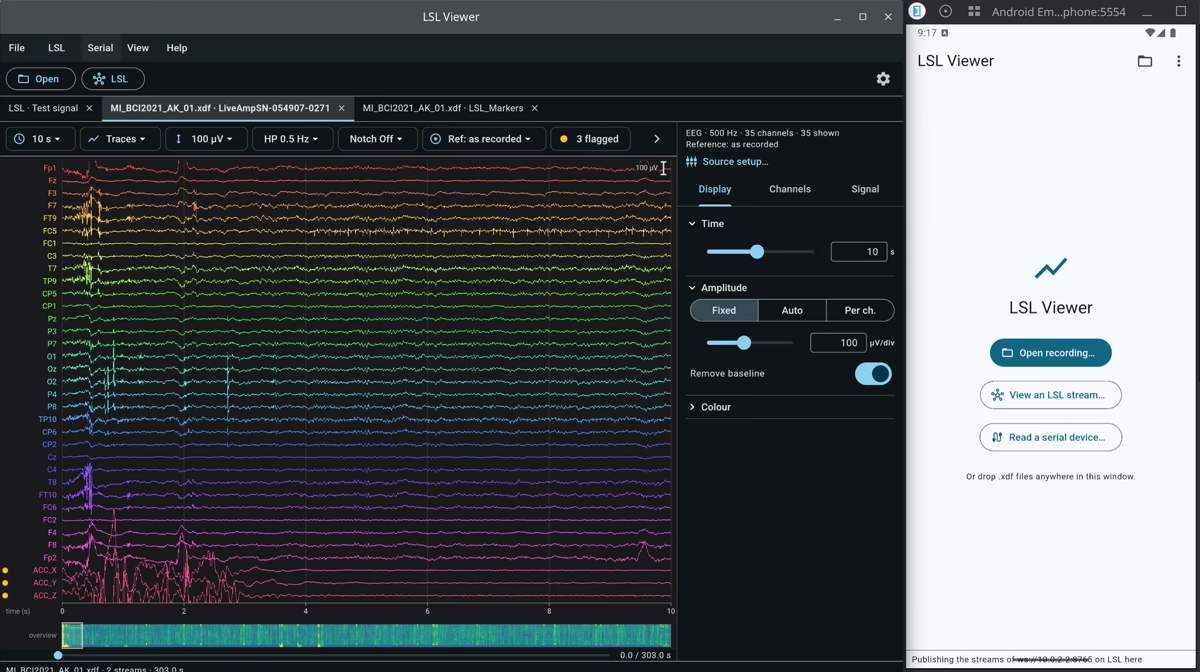
LSL Viewer Supports LSL streams, serial ports, XDF files (including replay). Native support for Windows, Linux, MacOS and Android (iOS can be built, but requires special entitlements from Apple). Also available online as a web application that can work with LSL streams via a WebSocket bridge (see LSL WebSocket Bridge).
MATLABViewer Allow visualizing, filtering and saving data in EEGLAB format. Exist as a compiled standalone application (see GitHub release) with no MATLAB installation necessary, or as an EEGLAB plugin.

StreamViewer (old version; used to be hosted at SCCN ftp as part of the mobi_utils package: ftp://sccn.ucsd.edu/pub/software/LSL/Mobi_Utils/mobi_utils_1_1_10/)

https://github.com/labstreaminglayer/App-SigVisualizer (Python/PyQt5 based - From Yida Lin and Clemens Brunner)

PlotJuggler supporst LSL streams and other data sources.
Older LSL-Inlet Plugin
The python bindings contain a very basic visualizer. To start it, install pylsl and pyqtgraph and run it as
python -m pylsl.examples.ReceiveAndPlot.